Abstract :
[en] Roughness description and characterisation of major fractures in Coniacian chalk at Wellington quarry (Arras, France).
Marie-Laure WATTIER1, Sara VANDYCKE2, Françoise BERGERAT3, Fanny DESCAMPS4 & Jean-Pierre K. TSHIBANGU5
1, 2, 4 &5 UMons, Mining Engineering Department of the Faculty of Applied Sciences, 53 rue du Joncquois, 7000 Mons, Belgium.
3 Sorbonne Universités, UPMC Univ Paris06, CNRS, Institut des Sciences de la Terre de Paris, France
Introduction
A dozen meters below the city of Arras lies a vast network of about 20km of tunnels initially resulting from the intense production of chalk by room-and-pillar method since the XVIth century. The network was further developed into warrens in the First World War. The architecture of the widespread complex lying under the city clearly benefits from an intelligent use of the main tectonic structures present within the Upper Cretaceous Coniacian chalk rock mass.
The objective of our study was to establish a description of chalk fractures from the small-scale (sub-millimetric) up to the macroscopic scale, associating the analytical quantitative description of joints and faults in terms of roughness, together with qualitative observations of the geological features, within the related tectonic system.
Work process
In the southern-most parts of the Wellington quarry complex, the primary networks of subvertical joints and faults, orientated 105-125°N and 160-180°N, allowed for relatively easy rock removal during quarry production and provided planar pillar walls for a naturally stable structure. So, natural fractures can be directly observed and characterised along the galleries. Samples were hence collected at 12 different spots.
Once in the lab, small cylinders were cored from collected blocks. Series of cylinders were broken in half - by tensile (Brazilian) or shear method, to be compared with natural fractures. On the natural surfaces, fault planes striations, ridges, twist hackles and plumose structures were observed. After visual classification, all samples were scanned with a high-precision laser to digitize the 109 fracture surface topographies (30x30mm square grids with 172µm spacing in X and Y directions, Z accuracy +/-30µm). Systematic computation of roughness indices was conducted using 3 statistical parameters and 2 fractal dimensions. The roughness indices calculated are: R_a^m, the average height of asperities above the median, its associated standard deviation σa, the root-mean-square parameter Z2, the fractal dimensions for the semi-variogram Dvar and for the yardstick rule Dyard.
Results summary and highlights
Additionally to the roughness indices computations, all the observed fractures were classified visually in terms of texture (granularity) and fracture surface waviness. Z2 and Dyard provide the most consistent results in comparison to visual observations.
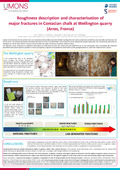
Lab-generated fractures display distinctively higher roughness indices than natural fractures (see Fig.1): average Z2 varies from 1.22 down to 0.41 and Dyard goes from 1.0104 down to 1.0039. This matches visual observation and is particularly true for natural fault planes that present significantly smoother surfaces, as also seen on samples, with marked oxidation and weathering.
Fig.1 Roughness indices Z2, Dyard and Dvar for lab-generated fractures (F=sheared cylinders, J=tensile split cylinders) and natural fractures (F= faults, J=joints). Shear 1, 2 &3 correspond to shear tests with increasing lateral confinement. Normal faults Fn, shear faults Fs, subvertical joints J, diaclastic joints Jd and stratigraphic joints Js are also detailed. The number of samples used for the calculations is noted at the base of each category.
Within the artificially-made series of fractures, for shear fractures, roughness increases with higher lateral confinement, but the highest roughness values are seen on tensile fractures. Within natural fractures, large-scale subvertical joints see the highest roughness, while other joints are only incrementally rougher than the fault planes.
Upon observation, natural joints display a roughness comparable to that of lab-generated tensile fractured samples. However, calculated indices distinctively show a gradation: Z2 and Dyard are representative of the trend, with respective average values of 0.32, 0.34, 0.66 and 1.79 for Z2 and 1.0027, 1.0035, 1.0083 and 1.0150 for Dyard when looking at stratigraphic joints, small diaclastic subvertical joints, large subvertical joints and lab-generated tensile joints (in this order).
Natural fault planes appear much smoother than lab-generated shear surfaces with average values of 0.40, 1.0031 and 1.3217 for Z2, Dyard and Dvar, and 1.05, 1.0091 and 1.3574 respectively. Roughness indices clearly rise in the following order: natural shear fault planes, natural normal fault planes, lab-generated shear planes from tests with increasing lateral confinement.
References:
Bergerat, F., Jacques, A., Vandycke, S., Amédro, F., Robaszinski, F. & Faÿ, O., 2015. Les Carrières Souterraines d'Arras : Géologie, archéologie et histoire. Bulletin d'information des géologues du bassin de Paris, 52, 3, 3-26.